
Bitcoin Price Analysis by Expert Eric Krown: Short-Term Bounce, Long-Term Correction Ahead
Once again, we gather around to dissect the ongoing battle of good vs. evil in crypto markets. In this analysis, Expert Eric Krown breaks down Bitcoin’s short-term price action, medium-term probabilities, and long-term risks — with some hard truths about what lies ahead.
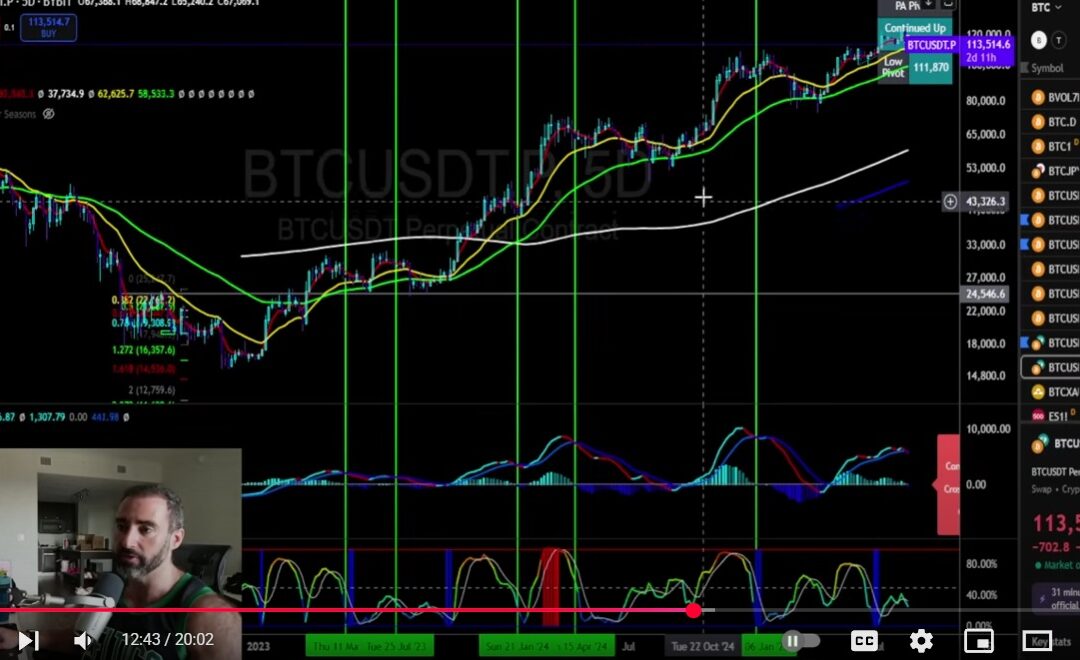
Here Is My Long-term View Of Bitcoin In The Next 3-5 Months
Daily Bitcoin Statistics: Why Thursdays Matter
Looking at daily price stats since 2023, Thursdays are the most bearish day of the week:
-
56% of Thursdays close negative.
-
Average Thursday loss: -1.8%.
For today’s levels, that translates to Bitcoin targeting around $112,300 on the downside — the August lows. On the flip side, a typical bounce could carry BTC up toward $116,500.
👉 Short-term traders: Watch for a wick into support before a relief rally.
Moving Average Cross Setup: History Repeats
Over this bull market, Krown has tracked a recurring setup: when the red and yellow moving averages cross down, BTC gravitates toward the green MA.
-
This has triggered 13 times since 2023.
-
11 out of 13 times, the signal has been profitable.
That target was officially hit earlier this week, fulfilling the downside setup. Now the real question: what comes next?
Historical Analogs: Bounces After the Drop
Looking back at similar setups:
-
June 2024: After tagging the green MA, BTC rallied +10.5% in 7 days.
-
January 2024: Same setup led to a +16% rally in a week before continuation.
-
Other cases saw 7–8% short-term bounces before dipping lower.
📌 Expectation: A bounce is probable, but the larger corrective phase isn’t done.
Three Down Days From Highs – Bearish Signal
Another red flag: three consecutive red candles after a high. Historically, this precedes multi-month corrections.
-
March 2024 → 6-month correction.
-
Dec–Jan 2023/24 → multi-month sideways + downside.
-
Current → signals 3–6 months of corrective action.
Meta Signals: Bounce Before More Pain
Krown highlights a Meta Signal on the 8-hour chart:
-
Entry around $114K.
-
Target #1: $119K (74% historical hit rate).
-
Timeframe: ~40 hours (under 2 days).
He stresses this is not new all-time-high material — just a relief bounce before further downside pressure.
MACD & RSI Divergence: Bearish on Higher Timeframes
On the 5-day and 10-day charts:
-
Multiple drives of bearish divergence on both MACD and RSI.
-
First MACD downside cross since January 2024 — historically a precursor to major corrections.
-
Target zone: $99K–$104K (green MA support).
Short, Medium, Long-Term Outlook
-
Short Term (days–weeks): Relief bounce toward $116K–$119K possible.
-
Medium Term (3–6 months): Sideways to lower, potential retests of $105K–$103K region.
-
Long Term (end of 2024 / early 2025): Sets up for a healthier stair-step advance, but no parabolic moves yet.
Key Levels to Watch
-
Support: $111,900 (August lows).
-
Bounce Targets: $116,700 → $118,200 → $120,000.
-
Invalidation: Closing below $111,900 accelerates downside.
Final Thoughts from Eric Krown
While short-term bounces are probable, the higher-timeframe signals are stacked bearish. Bitcoin may trade sideways with sharp rallies, but the weight of probability leans toward a deeper correction.
As Krown says: “Nothing is guaranteed — but trading must be rooted in hard numbers, not fairy dust. Expect volatility, use statistics, and don’t get lost in hopium.”

Crypto Rich ($RICH) CA: GfTtq35nXTBkKLrt1o6JtrN5gxxtzCeNqQpAFG7JiBq2
CryptoRich.io is a hub for bold crypto insights, high-conviction altcoin picks, and market-defying trading strategies – built for traders who don’t just ride the wave, but create it. It’s where meme culture meets smart money.